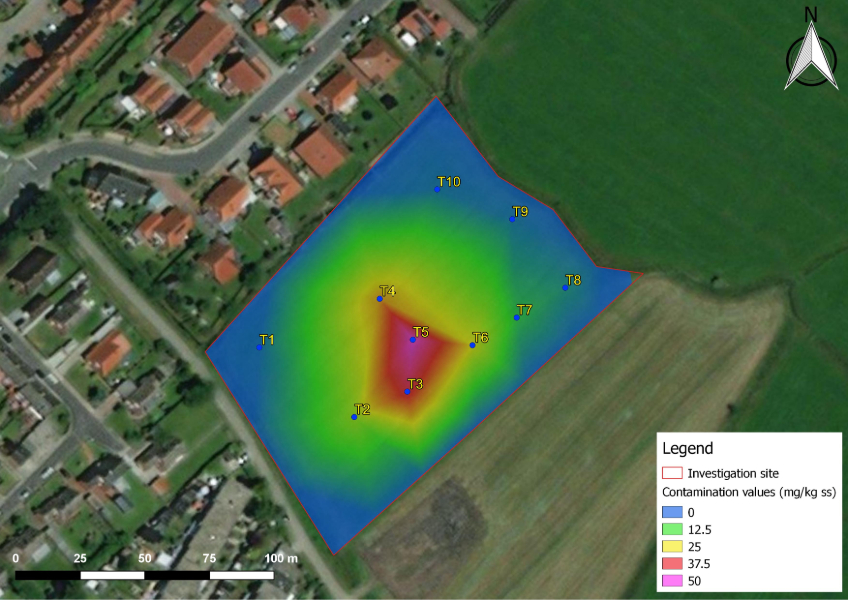
What’s a contamination map?
Contamination maps are graphic products aimed at representing pollutants’ spread and concentration. These maps are effective tools, used to verify contaminants’ presence in environmental matrices like groundwater and soil, and to determine the contamination extension inside the area.
These maps show the extent of contamination in different environmental matrices, like soil or groundwater. Normally, we can detect contaminants during an environmental investigation, by collecting and analysing soil or groundwater samples. Processing analytical results allows us to realize a precise contamination representation, through a contamination map that plays an important role to visualise the real contamination extension. Being a graphic product of clear and intuitive comprehension, contamination map is essential in processes like new land acquisitions and due diligences.
How do we realise them?
Environmental contamination maps are based on the analytical interpretation of the environmental samples collected during site investigations. The software QGis allows us to display the contamination values of different pollutant analytics like heavy metals, hydrocarbons, chlorinated substances, BTEX, PAH and pesticides. Colour and staining intensity indicate a contaminant presence and its absolute value on the map.
 The most straightforward use of the contamination map consists of identifying contaminated soil excavation volumes and, in order to do that, we interpolate the so-called Thiessen polygons, developed in different depth ranges of the contamination map. By applying the Thiessen polygons method, a distribution of points becomes a distribution of areas. That leads us to calculate for each layer its own contamination volume, and by summing all the layers we have the overall volumetric estimation of the contaminated soil.
Condividi questo Articolo


